Skip to content

Land Sensing Geospatial Analytics

From Satellite to Decision

Satellite observation, machine learning and field verification, combined into evidence that you can act on.

The four stages at a glance

Four stages, every project

Every project follows the same transparent process: select suitable data, analyse it, check results against field evidence, and deliver clear outputs that support decisions.

01

Data

Satellite and field data

02

Analysis

Mapping and change detection

03

Field verification

Reference points and accuracy checks

04

Decision

Maps, statistics and reports

1

Stage 1

Data — what we observe

We select data based on the question, area size, required detail, available budget and cloud conditions.

◈

Satellite imagery (free)

Useful for regional coverage and repeated monitoring.

  • Sentinel-2 (optical)
  • Landsat (optical)
  • MODIS (optical)
  • Sentinel-1 (radar)
Covers large areas and supports comparisons over time.
▧

High-resolution imagery

Commercial or licensed imagery when small features need more detail.
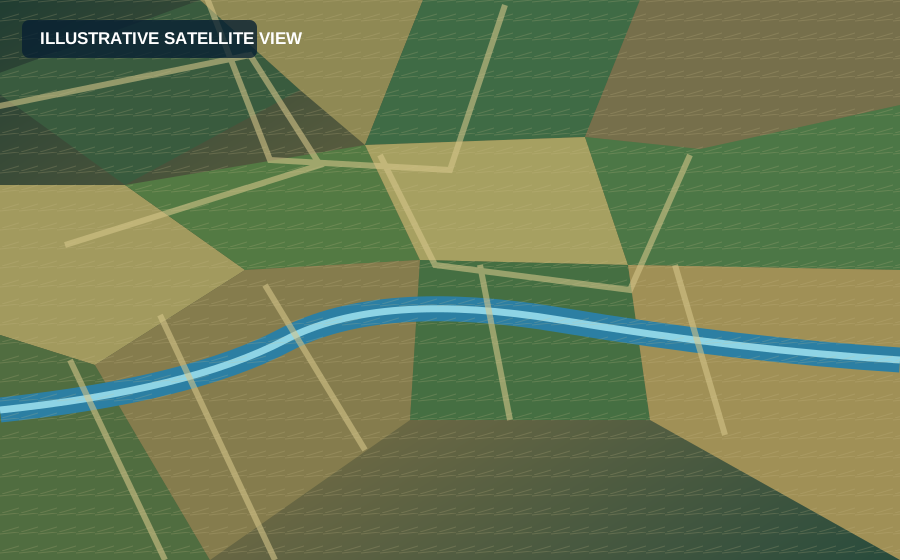
Illustrative satellite imagery of field parcels
Used selectively where extra detail changes the analysis.
▱

Other geospatial data

  • Elevation models (DEM)
  • Rainfall and temperature records
  • Existing maps and boundaries
  • Administrative and watershed data
Illustrative mountainous watershed
⌁

Drone and field data

Local observations that add detail and help check satellite interpretation.
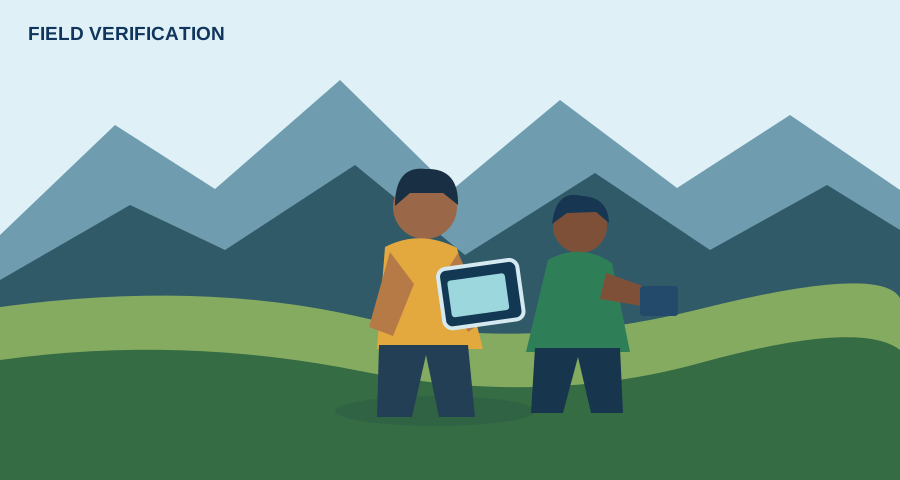
Illustration of field verification
  • GPS reference points
  • Geotagged photos
  • Short field observations
Free data first: use open satellite data where it is suitable. Licensed imagery or field collection should be proposed only when the project needs it.
2

Stage 2

Analysis — turning data into information

We combine remote sensing, geospatial processing and statistical methods to produce interpretable results.

Land and crop mapping

Classify land use, crop types and seasonal patterns using satellite imagery and reference data.
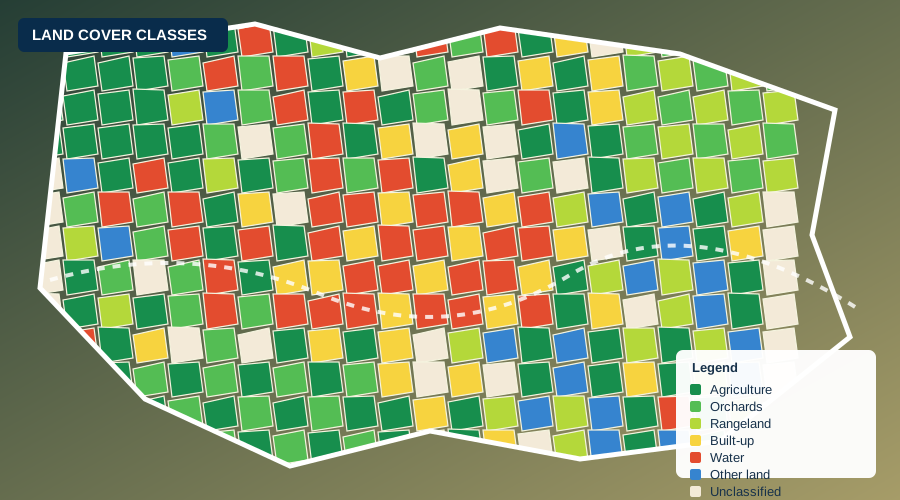
  • Land use and land cover
  • Crop types and seasonal change
  • Area estimation and class statistics
Illustrative classified land cover map

Spectral and climate indices

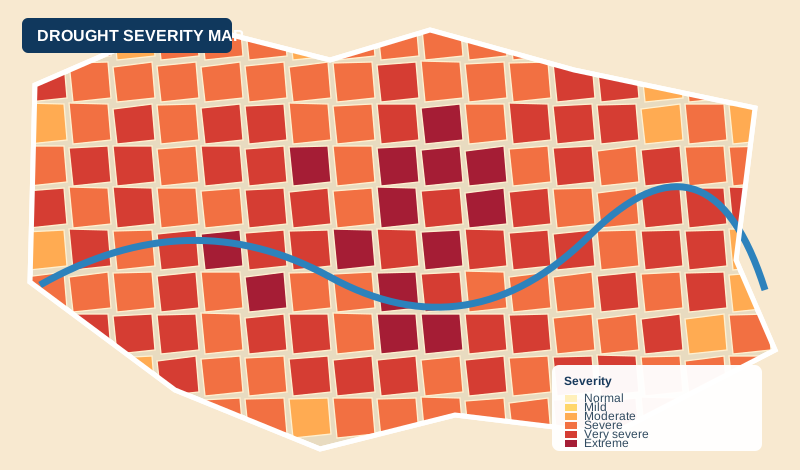
Use indicators such as NDVI for vegetation, NDSI for snow and SPI for drought when relevant to the question.
NDVI · VegetationNDSI · SnowSPI · DroughtLST · Temperature
Illustrative drought severity map

Time series and change detection

Compare seasons or years to detect change in crops, vegetation, water or land cover.

Cloud processing and reproducible methods

Where appropriate, cloud platforms can process large satellite collections and keep a clear record of the method.

Google Earth EngineQGISPythonR
Satellite data→Processing→Validated map
3

Stage 3

Field verification — checking results on the ground

Field evidence helps test whether the map reflects real conditions. The sampling design and limits are reported with the results.

Field data collection

Field analyst collecting GPS and photo references
  • Collect GPS points at selected locations
  • Record photos and brief observations
  • Cover relevant land and crop classes
Reference pointsVerified sample locations
↓
Training dataUsed to build the model
Validation dataHeld back for testing
↓
Accuracy assessmentConfusion matrix, class metrics and limitations
The proportion of training and validation samples depends on the project design. Any percentages or accuracy figures on the website must match the real project report.
4

Stage 4

Decision — clear results you can use

Outputs are prepared for the people who need to plan, report, allocate resources or monitor change.

▦

Maps

Clear, georeferenced maps for viewing and print.

GeoTIFF · PDF
▤

GIS data

Spatial layers ready to use in GIS software.

GeoTIFF · Shapefile
▥

Area statistics

Area estimates, summary tables and class totals.

Excel · CSV
✓

Accuracy report

Methods, validation and result limitations.

PDF
⌘

Dashboards

Interactive maps and key project indicators where needed.

Web dashboard
▧

Plain-language reports

Concise findings and implications for decisions.

PDF

Worked example

Khulm crop mapping — from data to decision

An example of how a crop mapping project may progress through the same four stages. Replace this example with approved project details and verified results before publication.

1. Baseline dataIllustrative satellite baseline

Choose suitable satellite observations and define the study area.

→
2. AnalysisIllustrative land cover output

Prepare seasonal composites and classify the relevant crop types.

→
3. Field verificationIllustrative field validation

Compare mapped classes with reference points and field observations.
→
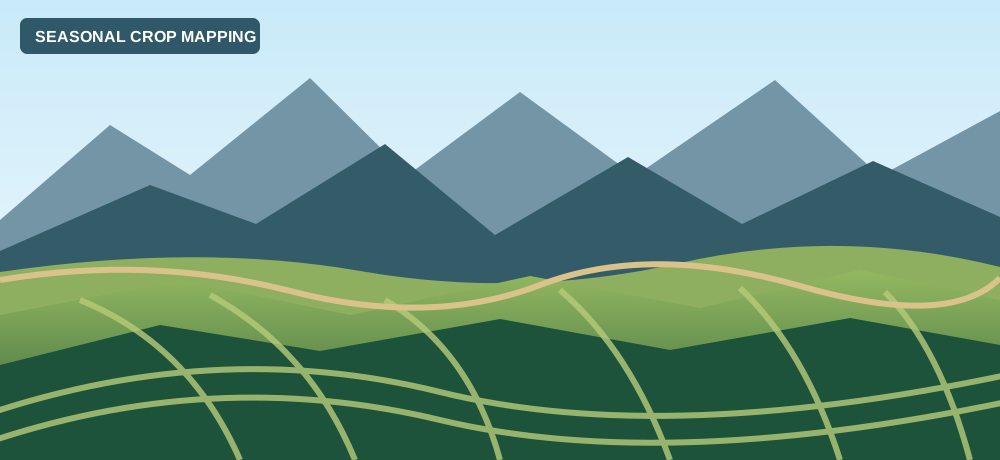
4. Final resultIllustrative crop mapping result

Deliver validated maps, area estimates and a clear methods summary.

Tools we use

Established geospatial tools

Google Earth EngineCloud processing
GIS softwareSpatial analysis and mapping
RStatistical analysis
PythonData processing and modelling

Get in touch

Need verified information for your project area?

Tell us what you need to know, and we will propose how to answer it.

Contact us →